Carl R. Woese Institute for Genomic Biology


Reef-building corals continuously deposit calcium carbonate under the form of aragonite, forming skeletal growth bands of varying density as they are precipitated under different environmental conditions. Therefore, the coral skeleton potentially represents a long-term record of the environmental conditions at the time of the skeletal deposition. This has resulted in corals being utilized in many paleothermometry studies to reconstruct historical sea surface temperatures.
Coral skeleton density banding (CSDB) patterns, as revealed by standard X-radiography (XRD), provides the fundamental spatial and temporal framework in which O-isotope paleothermometry is completed for the reconstruction of sea surface temperature (SST). Accuracy in these historical SST estimates requires that mechanisms controlling the thickness, frequency and density of CSDB deposition are well understood. However, many aspects remain unknown, including whether CSDB is consistent within individual coral heads, as well as how many high-density bands (HDB) and low-density bands (LDB) are formed seasonally.

Image analyses applied to the 5 mm-thick billet 2 from the O. annularis coral head. Photograph (P) of coral billet. Original XRD image of coral billet. CLAHE (CLH) image of coral billet. Matrix kernel vertical (MKv) and horizontal (MKh) images of coral billet. Fast Fourier transform vertical (FFTv) and horizontal (FFTh) images of coral billet. Average intensities are derived from measurement of a 19.2 mm-wide (120 pixel-wide) swath centered along the length of each billet image. Intensities are normalized and arbitrary.


Novel imaging techniques are necessary for examining whole brain protein expression patterns. Animal brains are large, complex structures that are difficult to image comprehensively on thin sections by traditional immunohistochemistry (IHC) techniques.

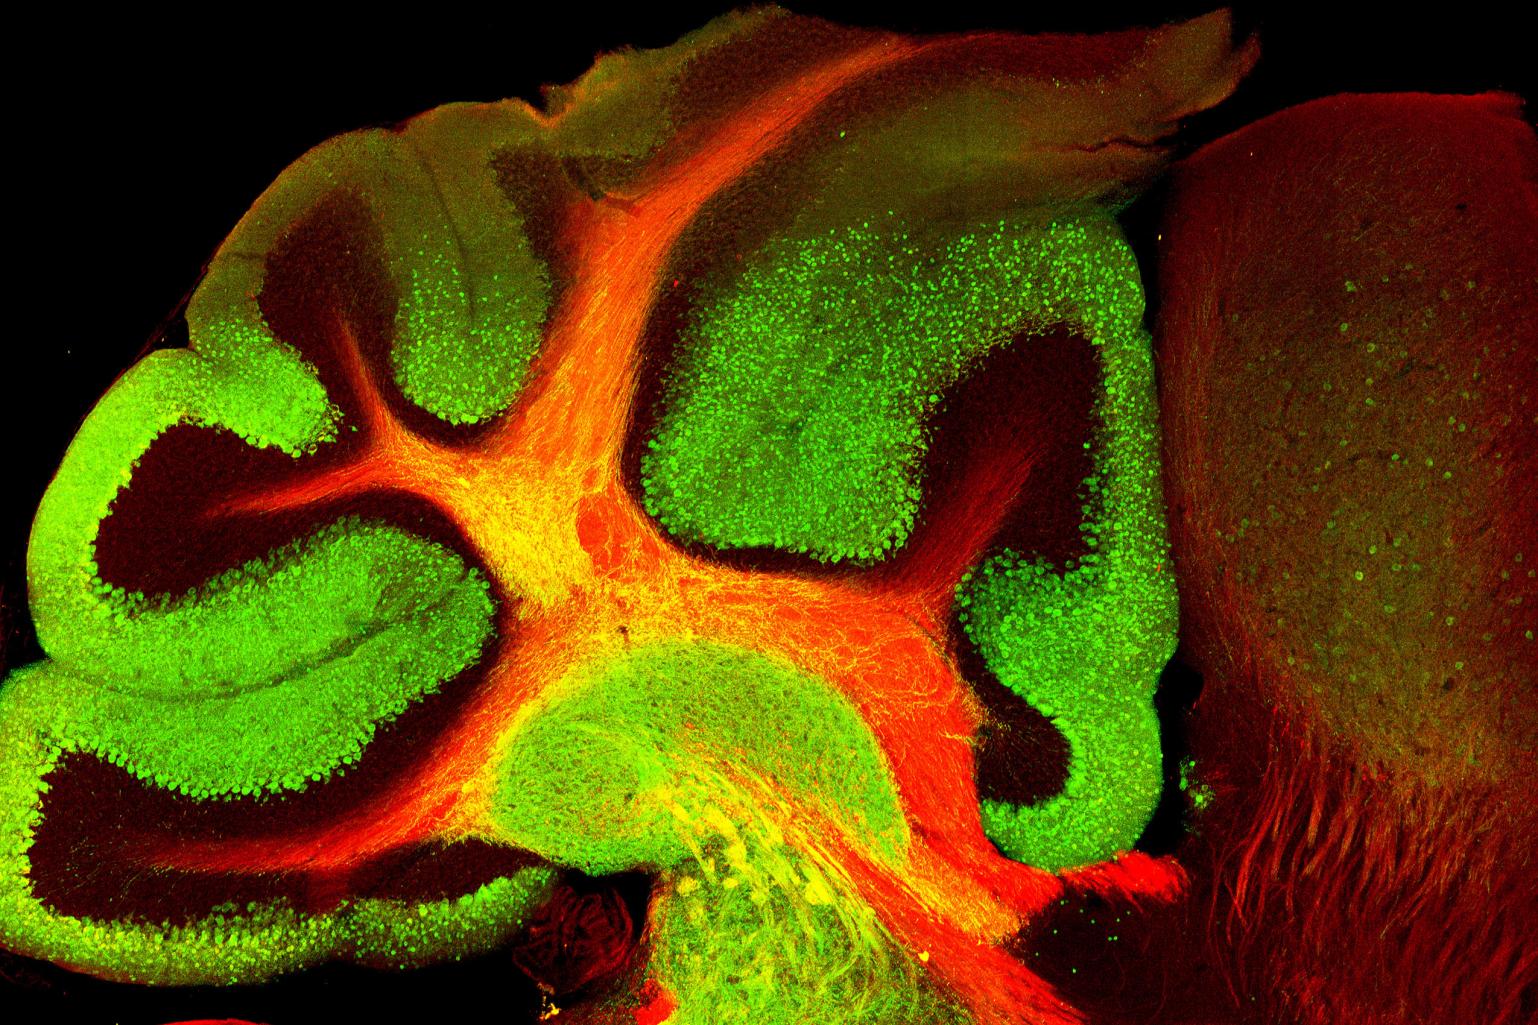
This image shows a 100um thick mouse brain slice, cleared with optimized CLARITY techniques for imaging on the IGB LSM 710 confocal microscope at 10x in three channels, with a tiling size of 15x9 and a z-stack of 10. The image was then rendered in 3D with Imaris x8.
The blue channel indicates nuclei with Hoechst stain. The green channel identifies GABAergic inhibitory interneurons with IHC for parvalbumin.
The red channel shows IHC for a transcription factor involved in neuron differentiation and social learning, Ttf1.
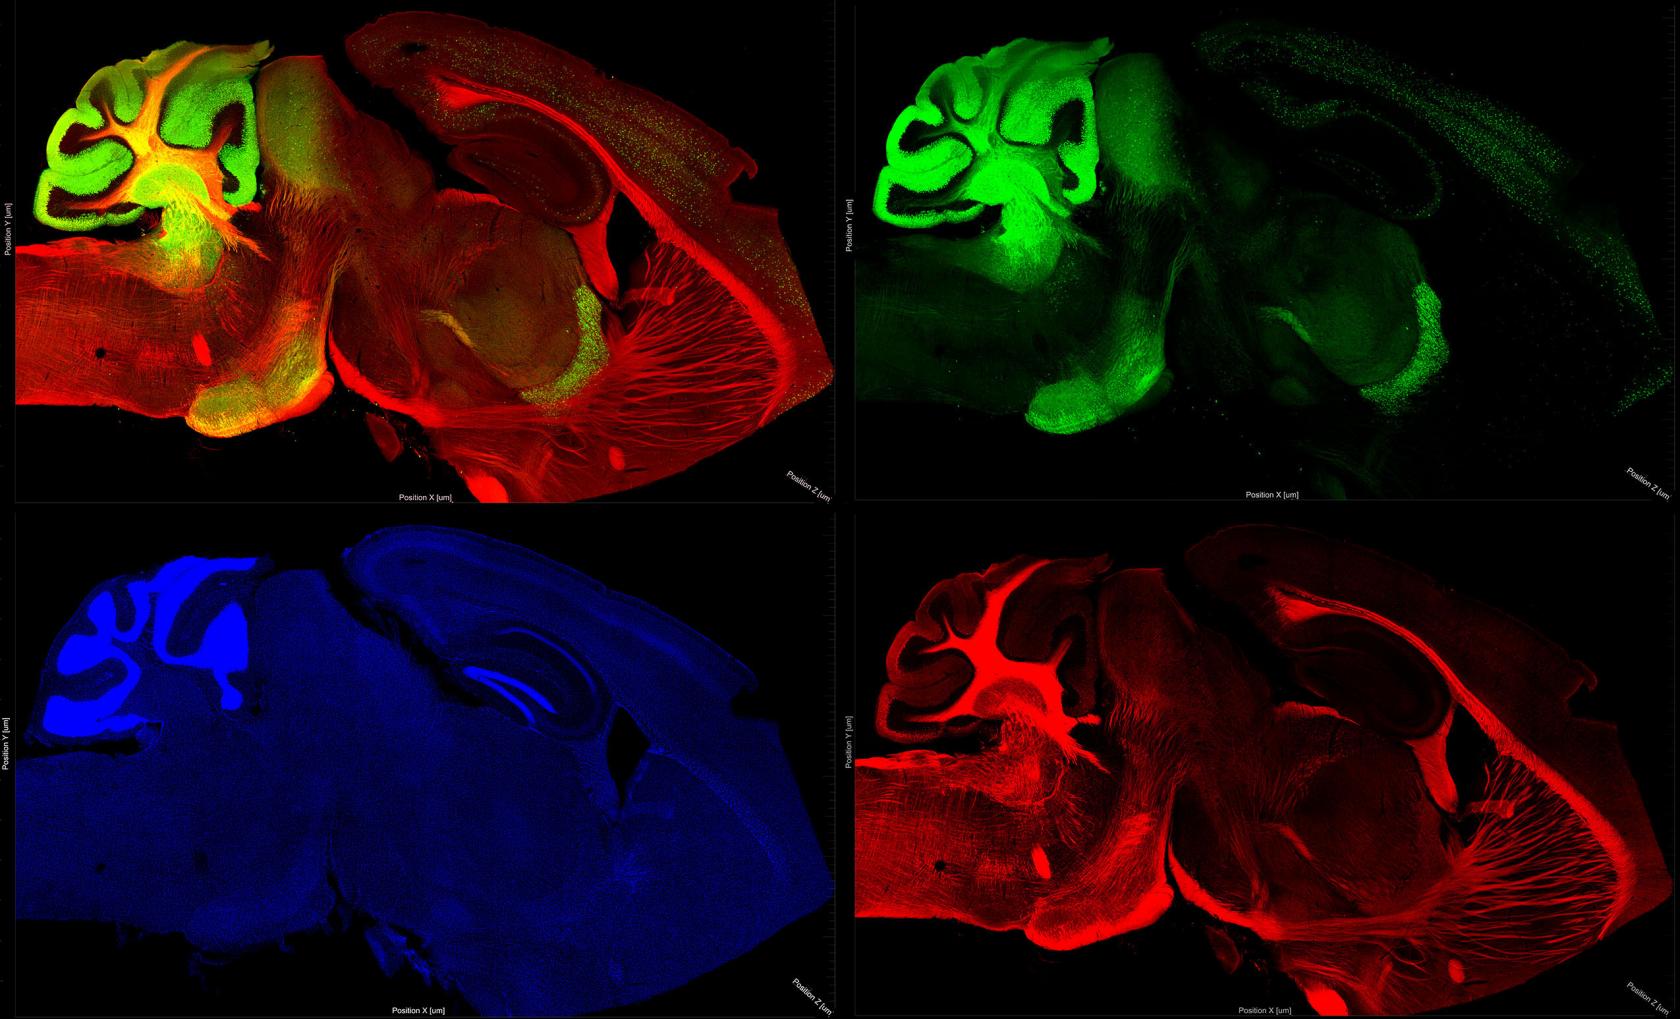
These exciting techniques allow imaging of complete brain structures while still allowing for cellular level resolution.


Imaging 3D structure of pollen is important in identification of the pollen species. The LSM 880 Airyscan system provides around 140nm resolution with 405nm excitation. Using the superior sensitivity and resolution of the Airyscan detector, the spikes, surface structure, entine and exine are clearly resolved through the entire depth of the pollen (~40 micron through the Z). The Sunflower (Helianthus sp.) pollen was labeled with Phloxine B and processed after collection (Helianthus sp.) from the Burlington, NC area.


This image shows a coronal section of a whole rat larynx. Muscle fibers are outlined in green and type IIb muscle fibers are stained red in the paired lateral thyroaryntenoid muscles (part of the vocal folds).
Stains: Muscle fibers: BF-F3 antigen, diluted at 1:3 to label MHC IIb (Developmental Studies Hybridoma Bank, Iowa City, IA) with secondary Alexa594, goat/anti-rabbit IgG2b, diluted at 1:200 (Invitrogen: Molecular Probes, Eugene, OR). Muscle fiber outline: anti-laminin, diluted at 1:200 to outline muscle fibers (Sigma-Aldrich, St. Louis, MO) with secondary Alexa488, goat/anti-mouse IgG1, diluted at 1:200 (Invitrogen: Molecular Probes, Eugene, OR).


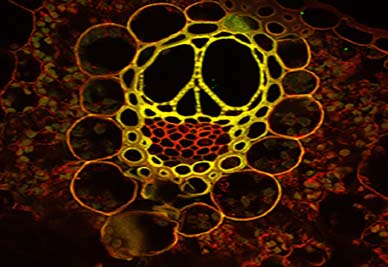
This image shows a sugarcane vascular bundle using two-photon excitation fluorescence with second harmonic generation.


Travertine Lights
This image shows the distribution and locations of nucleic acids in ancient travertine (calcium carbonate). A selective nucleic acid staining was done using a combination of SyBr Green and Hoechst Nucleic Acid stains. The image was taken using the AXIO ZOOM V16 microscopy.


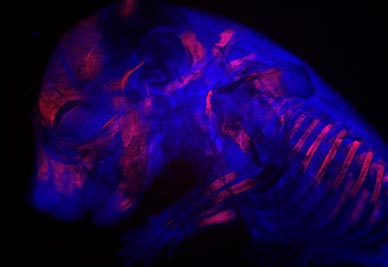
This is an embryonic day 17.5 mouse fetus that has been cleared and stained with Alcian blue and Alizarin red. It was imaged with the Axio Zoom V16 stereomicroscope using Zen Pro 2012 software. The blue and red stains highlight the cartilage and ossified bones respectively. This staining allows us to see how these structures are developing at various stages.


Cancer cells are seeded within a biomaterial hydrogel composed of gelatin and a gradated concentration of hyaluronic acid. This material is inspired by transitions found in the brain tumor tissue. Cells are treated with a current anti-cancer drug (Erlotinib) and their response is tested via cells that are alive (green color) and those that are dead (red color). Cell distribution and response depends on the spatial heterogeneity within the surrounding hydrogel (top image). Live tumor cells show diverse volumes as they interact with the controlled heterogeneous engineering matrix. Live cells are catalogued depending on their geometry (bottom image).

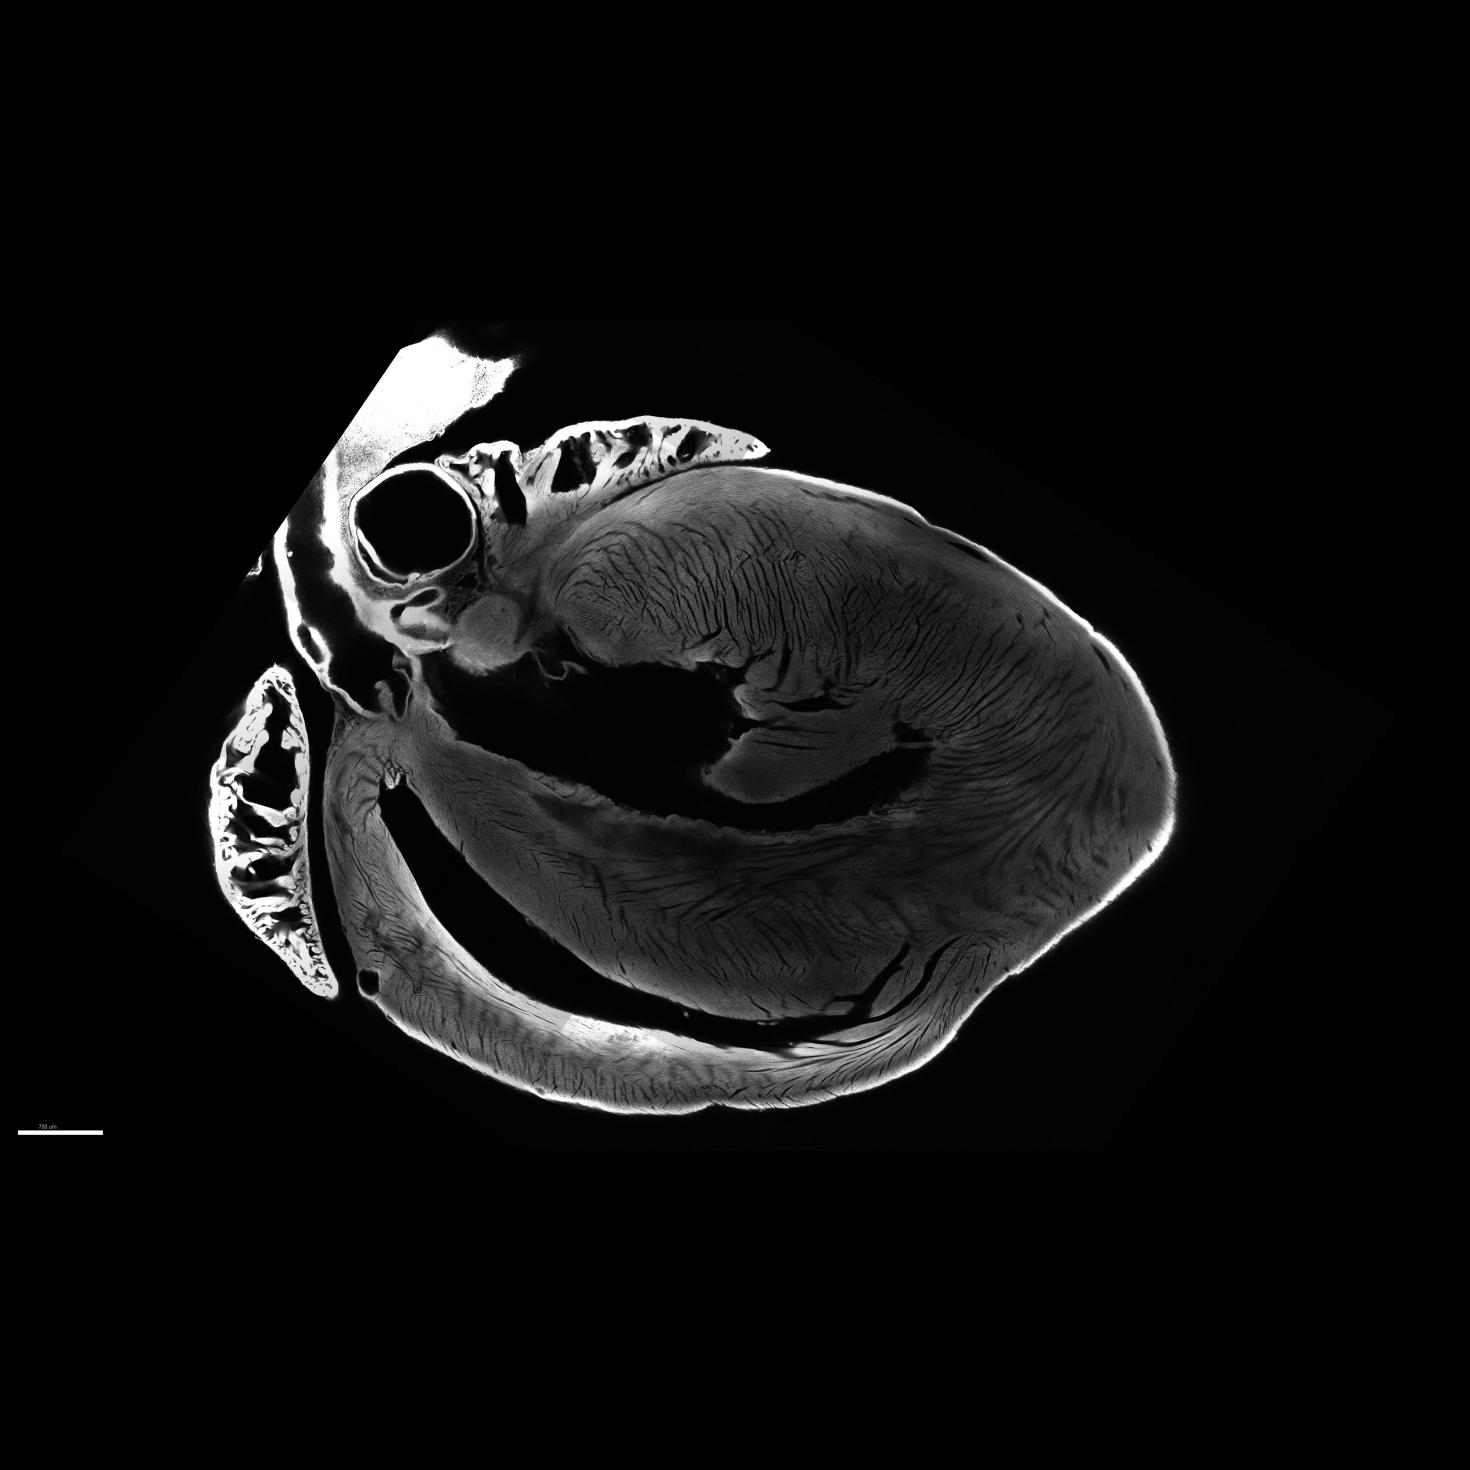
Image of a mouse heart cleared and imaged using the LSM 710 Two-photon microscope.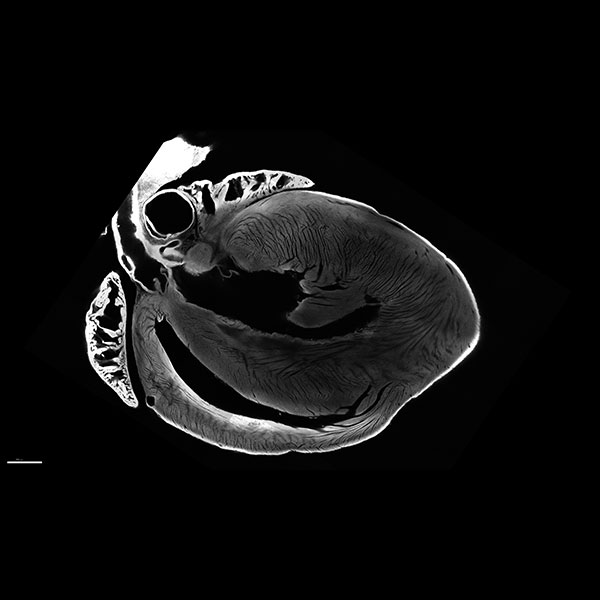


Gilial Cells-Structured Illumination Superresolution-3D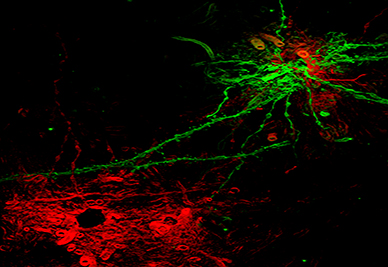

View Gallery
1
/
10
